EUR/USD Trading for July 31, 2014 (1/1 ITM)
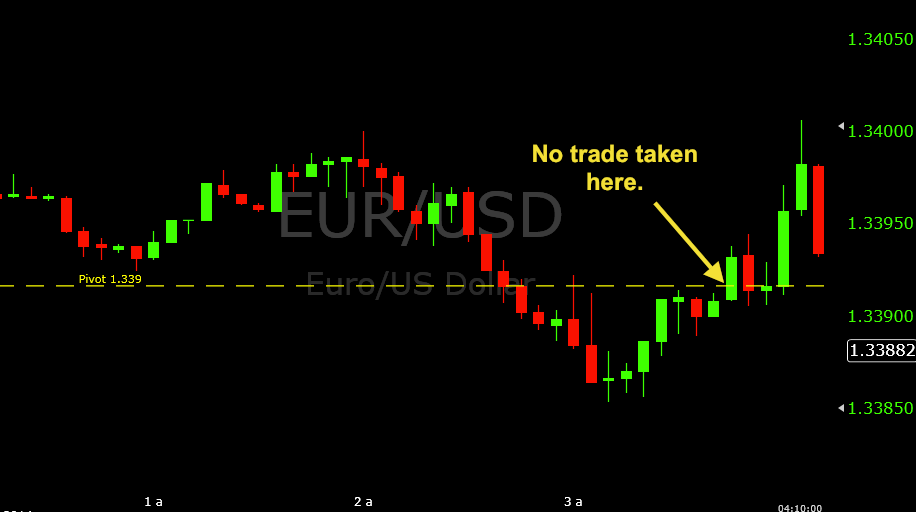
1. The first trading opportunity I encountered was not as easy when it came to making a cut-and-dried decision about if and when to get into the trade. The market broke down below the pivot level during the 2AM (EST) hour, and tested and rejected the level at the onset of the 3AM hour before going lower.
Consequently, the type of trade set-up I was aiming for would be put options at the pivot on a retracement back up. It came close on the 3:30-3:40 candles, but stopped short. Congestion just before a support or resistance level isn’t ideal, given that it can act as yet another congestion area conflicting with the intended direction of your trade. The image at the end of this particular segment provides a concrete illustration.
Additionally, I decided to at least look for another touch and rejection of the pivot as price action confirmation of continued robustness of that level. With the down-move that had just occurred, a temporary resting point for the retracement back up could conceivably occur at the pivot. But when reaching up to the pivot actually occurred on the 3:45 candle, it went right through it. After just a temporary stutter-step, the market would trade above the pivot for the next 2+ hours (at least in terms of open-and-close five-minute candles).
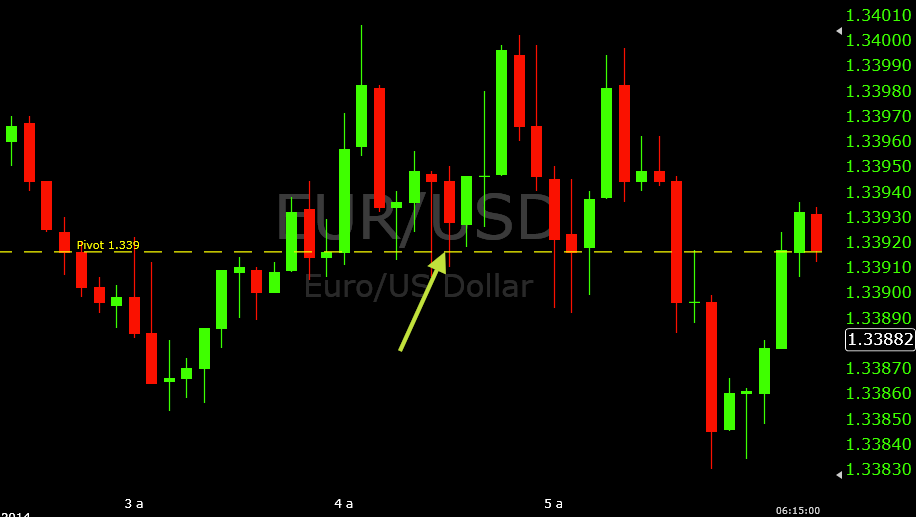
2. My first (and what would be my only) trade of the day actually turned out to be the opposite scenario. A call option at the pivot on a retracement back down after an up-move. A nice wick formed after a touch on the 4:10 candle, offering credibility to the pivot level as a reasonable call option area. The same thing occurred on the 4:20 candle, but only with an even larger wick. On top of that, minimal wick formed underneath the level, which suggested that the sellers didn’t have much force here.
Often, when a lot of wick is left under a level, it elicits the fact that the selling influence is relatively strong if it gets down that far in the first place. Ideally, you will have very little wick underneath, denoting a swift rejection at the level. Too often, many will get caught up on the wick itself, but if it’s hanging well below (denoting a false break), it could easily mean that a genuine break could be in store for the simple fact that the selling influence was so strong previously.
I was able to get into a call option on the 4:30 candle, and really had a nice trade with this one – about an eight-pip winner. It really did set up quite well, and definitely sticks out in my head as one of the more memorable trades as of recent.
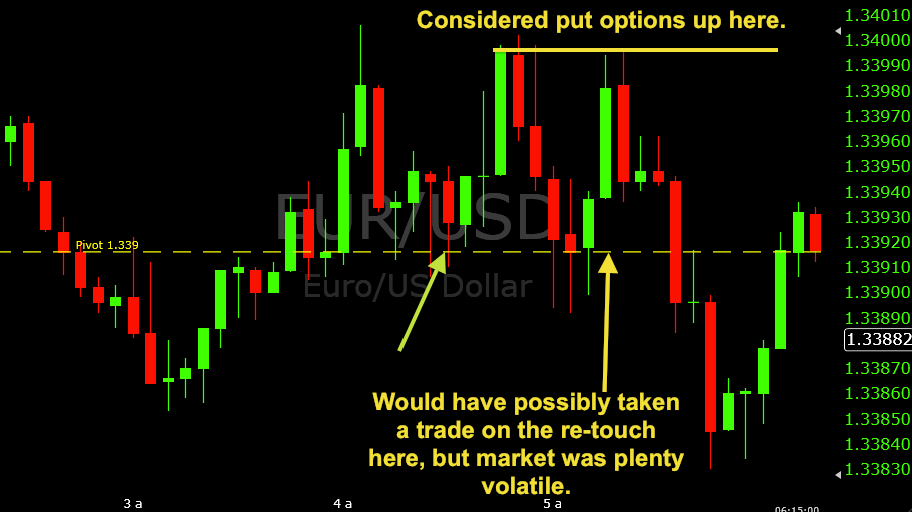
3. The end of the previous trade coincided with some resistance seen along the 1.3400 level. This, as many might recognize, constitutes what’s regularly considered a “whole number.” This was almost in play in some form later.
The same set-up as described in #2 occurred at the start of the 5AM hour. The difference here, however, is that the wicks reached lower beneath the pivot. Also, the bodies on the 5:00 and 5:05 candles sat very near the level instead of rejecting strongly as they did in the previous set-up. After a solid move back up on the 5:10 that suggested buying strength, I had re-considered the identical call option set-up. But price did not immediately return back down and instead headed up to the whole number.
Based on the previous resistance area that had formed around the whole number, I considered using it as a possible put option area (just below 1.3400), assuming the standard price action cues that I use set up properly. However, that never happened. Price fell and not so unexpectedly fell below the pivot.
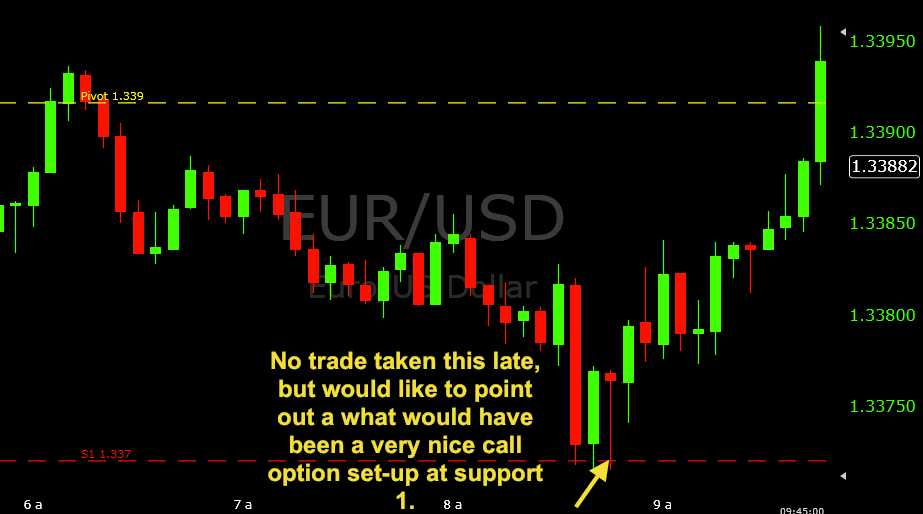
4. I did not trade the market much further after this, but I do want to point out a nice set-up that occurred later just before 9AM EST.
At news time, price touched the support 1 level, but did not contravene it. The following candle showed a bounce-back from the news and settled about five pips higher than support 1. The following candle would have provided a nice means of entering the market in the form of a call option, and the market expectedly rebounded from this news. It’s actually quite rare when data is released and the market falls, that the news release itself is the impetus that causes it to keep on falling. Usually there’s some sort of pull-back.
Overall, a 1/1 ITM day.
As always, please never hesitate to ask if you ever have any questions.


